
Sales Prospecting Statistics
By Rodylyn Villaflores · Co-Founder, LastDatabase
Published: 19 Jun 2026 · Updated: 20 Oct 2026 · Views: 424
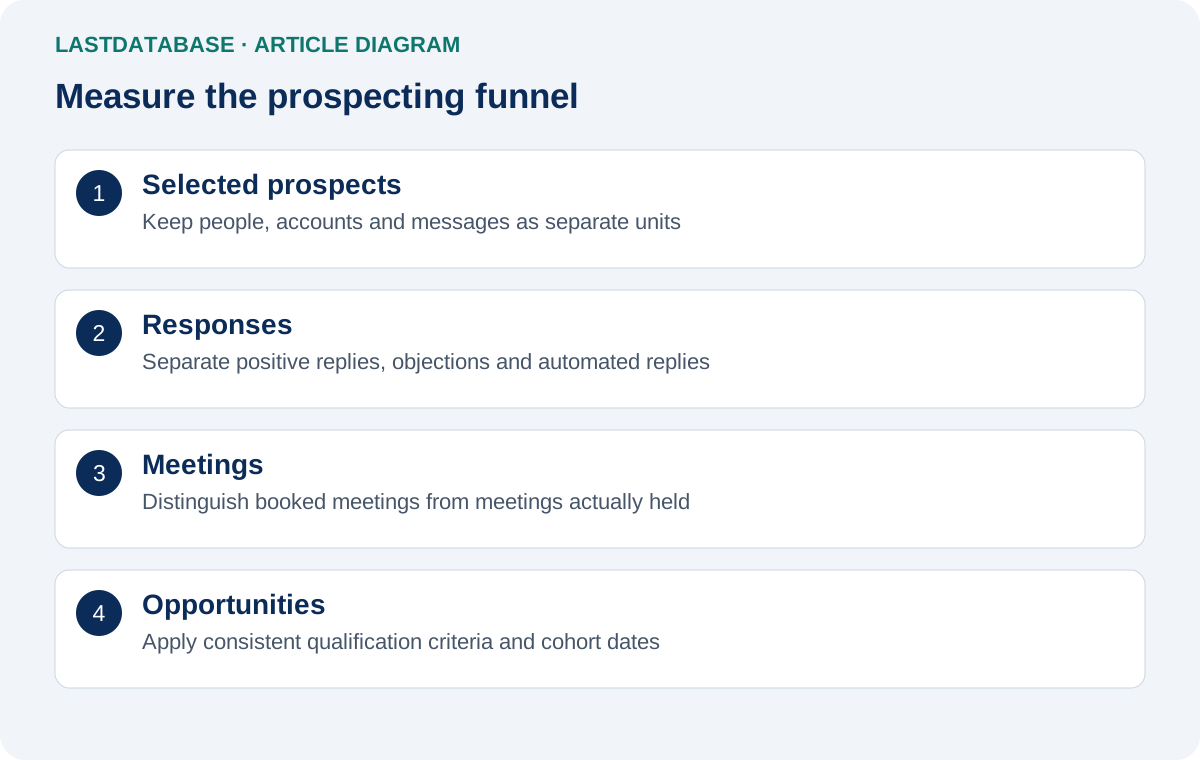
Sales prospecting statistics are useful when their definitions match the decisions you need to make. A response rate without a denominator, date range, and audience description is difficult to interpret.
This guide explains how to measure your own prospecting funnel. It does not report a LastDatabase campaign benchmark or promise a particular result.
Define your prospecting funnel
Record the stages from selected accounts to qualified opportunities. Keep contacts, accounts, messages, and meetings as separate units.
For example, three messages sent to one person are three attempts but only one contacted prospect. Mixing these units changes the meaning of your statistics.
| Metric | Calculation | What to define |
|---|---|---|
| Contact coverage | Target accounts with a relevant contact divided by target accounts | What qualifies as a relevant contact |
| Reply rate | Unique prospects replying divided by unique prospects contacted | Whether automated replies are excluded |
| Positive reply rate | Prospects giving a positive reply divided by prospects contacted | A consistent positive-reply rule |
| Held meeting rate | Prospects attending a meeting divided by prospects contacted | Booked meetings versus attended meetings |
| Qualification rate | Qualified opportunities divided by held meetings | Your opportunity qualification criteria |
Multiply each fraction by 100 when reporting a percentage. These are suggested reporting definitions; document any different definitions used by your CRM.
Use a transparent calculation
Hypothetical example: A team contacts 200 unique prospects. Twenty reply, eight give positive replies, and four attend meetings.
The reply rate is 10%, the positive reply rate is 4%, and the held meeting rate is 2%. These numbers illustrate the calculations only.
If two of the four meetings become qualified opportunities, the meeting-to-opportunity rate is 50%. That percentage represents just two outcomes and should not be treated as a stable benchmark.
Compare cohorts fairly
Separate results by audience, country, buyer role, data source, and outreach channel. Keep campaign windows comparable and allow enough time for responses.
Compare first contacts with first contacts, rather than combining new prospects with existing customers. Distinguish a single message from a completed sequence.
Use both counts and percentages. Report exclusions such as duplicate contacts, internal tests, and automated responses.
Evaluate published statistics
- Identify the original source and publication date.
- Check whether the study measures people, accounts, or messages.
- Review sample size, collection method, and audience selection.
- Look for definitions of replies, meetings, and qualified opportunities.
- Check whether unsuccessful campaigns were included.
- Separate observed associations from evidence of cause and effect.
A survey of sales representatives and an analysis of campaign logs answer different questions. Neither automatically predicts your team's results.
Connect measurements to actions
Low contact coverage may justify better account research. Replies without meetings may indicate weak relevance or an unclear next step.
Delivery failures require separate diagnosis. Review email bounce troubleshooting before assuming the message itself caused the failure.
For data selection, use the sales database evaluation guide. Track changes in a small comparable cohort before expanding.
About the Author
Rodylyn Villaflores
Co-Founder, LastDatabase
Rodylyn Villaflores is Co-Founder of LastDatabase. She contributes to LastDatabase educational content covering B2B data, lead generation, sales prospecting, data quality, and responsible data use.
View author profile →